How to Do Python Script Debugging on Claude Code (Step-by-Step Guide)
To debug Python scripts on Claude Code, open your terminal in the project directory, run claude, and either paste your traceback directly or use the /debug slash command on a specific file. Claude Code reads your local files, interprets the full stack trace, and proposes targeted fixes in context — no copy-pasting between browser tabs required. Designed for developers who want to stay in their editor flow, it works best on Python 3.8+ projects with a virtual environment already activated.
- Claude Code can read local files directly — no need to copy-paste code into a chat window
- Debugging sessions consume tokens from your plan's usage limit; a complex multi-file debug can use a significant chunk of your 5-hour usage window
- The
/usagecommand shows your current consumption so you're never surprised mid-session
What is Claude Code and why use it for Python debugging?
Claude Code is Anthropic's agentic CLI tool that runs directly in your terminal. Unlike the web interface, it can read, edit, and execute files in your local environment. For Python debugging, this means it sees your full project structure: requirements.txt, virtual environments, test files, and multi-module imports that would be tedious to reproduce in a browser chat.
The key advantage is context. When a traceback references src/utils/parser.py:line 42, Claude Code can open that file, read the surrounding logic, and suggest a fix that accounts for the actual codebase — not a hypothetical snippet.
How to start a Python debugging session in Claude Code
Step 1: Open Claude Code in your project root
Navigate to your Python project and start the CLI:
cd my-python-project
claude
Make sure your virtual environment is active before launching. Claude Code will pick up the correct Python interpreter and installed packages from the local context.
Step 2: Paste or describe the error
The most direct path: run your script, copy the full traceback, and paste it into the Claude Code prompt. Be explicit:
I'm getting this error when running `python main.py`:

Traceback (most recent call last):
  File "main.py", line 18, in <module>
    result = parse_config("config.yml")
  File "src/parser.py", line 42, in parse_config
    return yaml.safe_load(f)
yaml.scanner.ScannerError: mapping values are not allowed here
Claude Code will read src/parser.py and config.yml directly to diagnose the issue.
Step 3: Use slash commands to target specific files
Claude Code's slash commands streamline the debugging workflow. Useful patterns:
- /debug: Attach a file and ask Claude to find the bug (e.g.,
/debug src/parser.py — why does safe_load fail on this config?) - /review: Ask for a code review focused on error handling and edge cases
- /test: Generate or run unit tests to isolate the failing logic
- /fix: Apply a targeted patch to a specific file after diagnosis
A full reference of available commands is in the Claude Code slash commands list.
Step 4: Iterate with targeted follow-ups
Debugging is rarely one-shot. After Claude proposes a fix, test it and bring back the new output:
Fixed the YAML issue, but now I'm getting:
AttributeError: 'NoneType' object has no attribute 'get'
on line 61 of src/processor.py
Because Claude Code retains session context, it connects the original parser bug to this downstream None propagation without you re-explaining the project structure.
Python-specific debugging techniques that work well in Claude Code
Traceback analysis for import errors
Import errors and circular dependencies are common in larger Python projects. Paste the full ModuleNotFoundError or ImportError traceback. Claude Code can inspect your __init__.py files, pyproject.toml, or setup.cfg to trace where the module resolution breaks.
Type errors and None checks
Python's dynamic typing means AttributeError and TypeError often surface at runtime rather than at write-time. Describe the expected type and the actual behavior; Claude Code can add targeted isinstance guards or suggest migrating a function signature to use type hints for earlier detection.
Test-driven debugging with pytest
Ask Claude Code to write a minimal pytest case that reproduces the bug before fixing it. This creates a regression test as a side-effect of the debugging session:
Write a pytest test that reproduces the ScannerError in parse_config,
then fix the function so the test passes.
Environment and dependency issues
If the bug is version-related (e.g., a deprecated API in a newer library version), share the output of pip freeze or poetry show. Claude Code can cross-reference known breaking changes and suggest a pinned version or a migration path.
How to reduce token usage during long debugging sessions
Complex multi-file debugging sessions consume tokens faster than simple Q&A. A few strategies to stay efficient:
- Scope the context: Reference only the files relevant to the bug rather than asking Claude to "look at the whole project"
- Be specific in prompts: "Why does
parse_configreturn None on line 42?" uses fewer tokens than "find all bugs in my codebase" - Batch fixes: Group related bugs in one prompt instead of separate back-and-forth turns
- Use
/usageto check your balance: Run/usageat any time in the Claude Code session to see where you stand in your current usage window
For a deeper look at minimizing consumption, see how to reduce Claude Code token usage.
The real risk: getting locked out mid-debug
Here's a scenario every developer eventually hits: you're 45 minutes into a tricky debugging session — you've identified the root cause, Claude has drafted the fix, you're writing tests — and suddenly Claude Code returns a usage limit error. You're locked out for the rest of the 5-hour window.
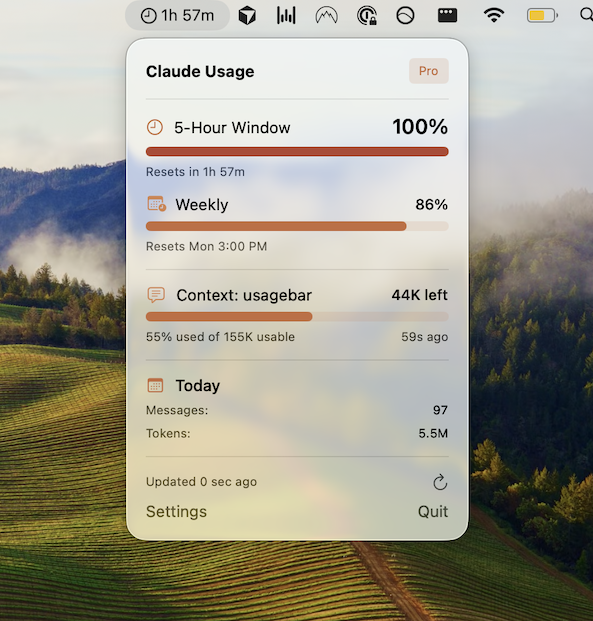
This is where monitoring your usage proactively makes a real difference. Usagebar is a macOS menu bar app that tracks your Claude Code usage in real time. It shows you exactly how much of your window you've consumed and fires notifications at 50%, 75%, and 90% — giving you enough runway to wrap up the PR, commit the fix, and not get blindsided.
It also shows you exactly when your usage window resets, so you can plan heavier debugging sessions around your limit cycle instead of discovering the reset time after the fact. Credentials are stored securely in macOS Keychain, and pricing is pay-what-you-want with a free option for students.
Get Usagebar — instant download, flexible pricing.
Checking your usage without leaving the terminal
You have a few options to check usage mid-session:
/usagein Claude Code: Built-in command that returns your current consumption stats inline- claude.ai/settings/usage: Browser-based dashboard with a breakdown by session
- Usagebar: Persistent menu bar indicator so you never have to context-switch to check — the number is always visible at the top of your screen
For a comparison of all methods, see how to check your Claude Code usage limits and the Claude Code usage statistics command guide.
Key takeaways
- Start Claude Code in your project root with your virtual environment active
- Paste the full traceback — Claude Code reads local files to give context-aware fixes
- Use
/debug,/fix, and/testslash commands to target specific files and actions - Ask Claude Code to write a pytest regression test before applying the fix
- Scope prompts narrowly to conserve tokens during long sessions
- Run
/usageperiodically or use Usagebar to avoid a mid-session lockout
Sources
Track Your Claude Code Usage
Never hit your usage limits unexpectedly. Usagebar lives in your menu bar and shows your 5-hour and weekly limits at a glance.
Get Usagebar